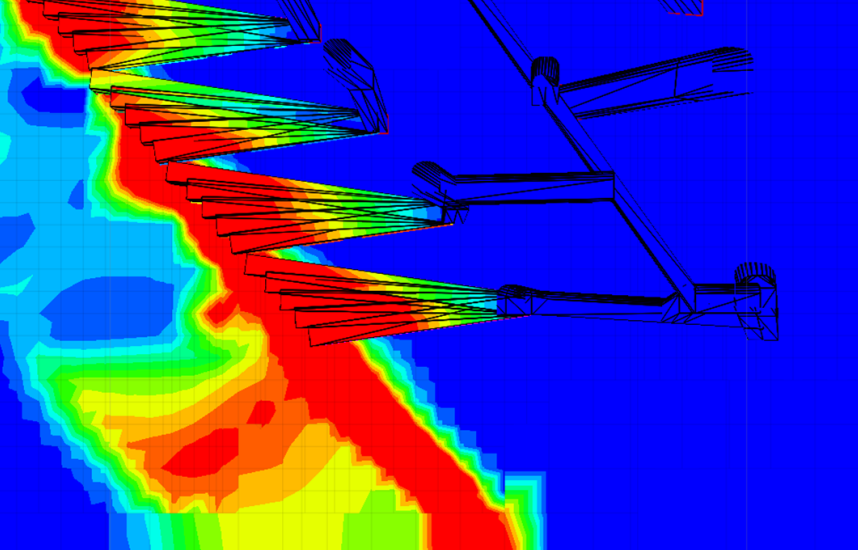
Itasca’s software allows users to create, import, and export geometric data sets, named collections of related NODES, EDGES, and POLYGONS (formats that can be imported are DXF, STL, and GEOM files). Such data sets can be used with 3DEC, FLAC3D, and UDEC models to quickly analyze your model data by visualizing properties and results (displacement, stress, strain, user-defined extra variables, etc.) by “painting” zone field values onto some geometry. An application of painting is visualizing how model values vary in relation to geometric features that might not be explicitly modeled, such as relatively small tunnels in a large mine-scale model. This permits visualization of stresses, rock mass properties, potential damage, or some closure estimate along planned tunnels.
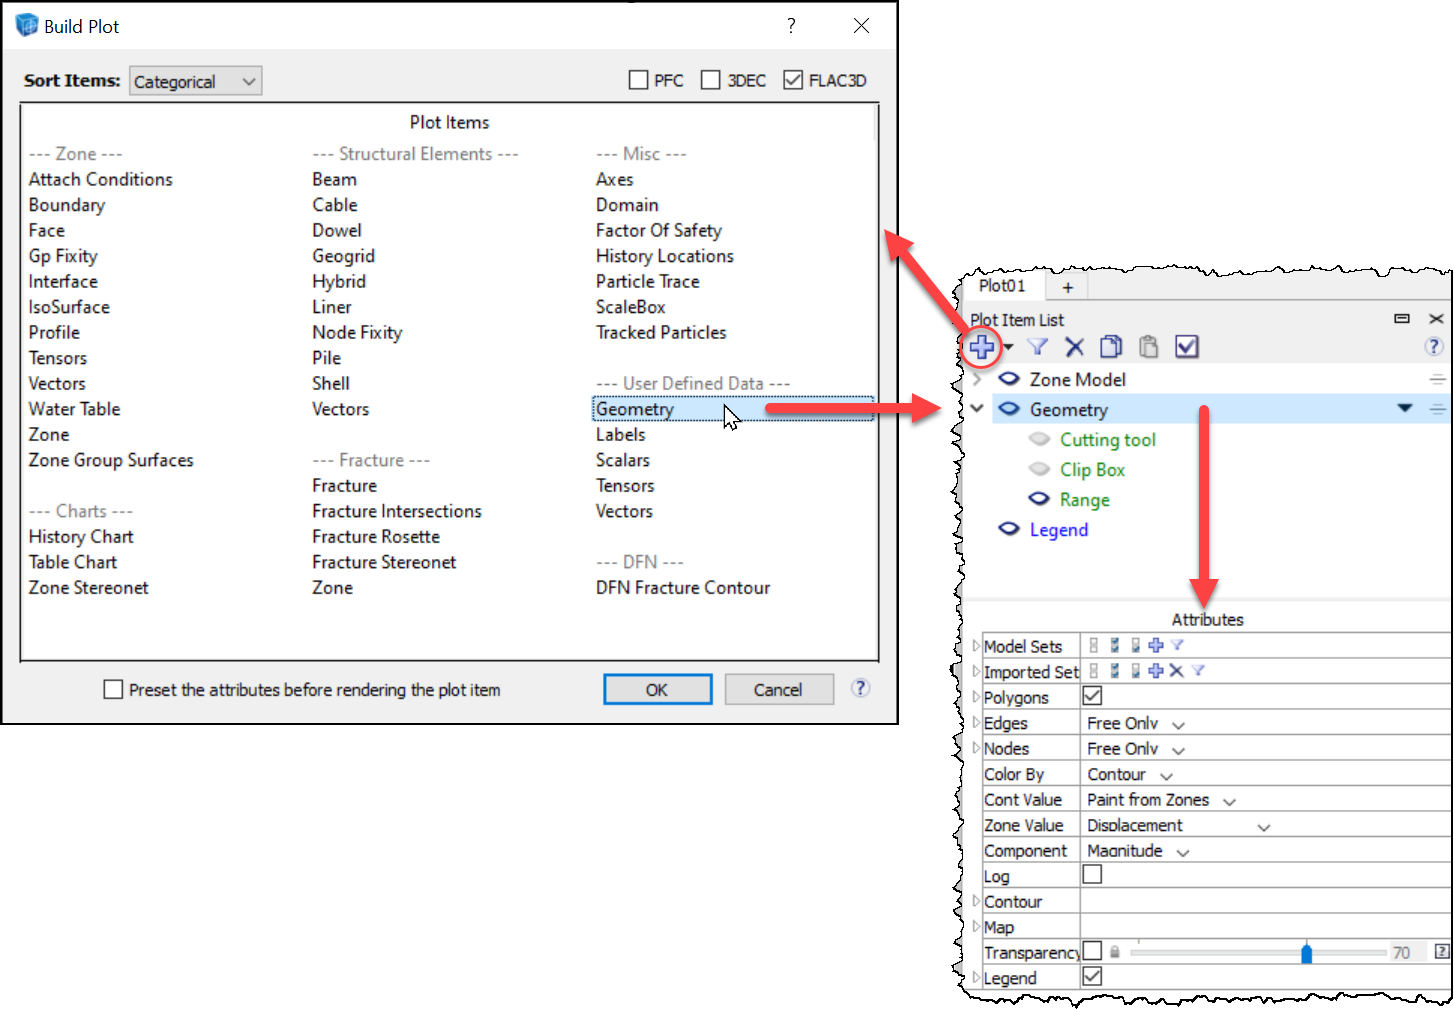
Geometry painting can be done easily using commands, FISH, or interactively via the Geometry plot item.
The geometry paint-extra command is used to “paint” zone field data values from the model to an extra variable stored in geometry nodes. For example, to paint the minimum principal stress in the model onto the active geometric set, use the command:
geometry paint-extra 2 stress quantity minimum
This will calculate minimum principal stresses at the location of all nodes in the active set and assign that value to extra variable index 2. Other values can then be assigned to different indices. The complete list of zone field variables available can be found in the geometry paint-extra command documentation. Similar FISH functions are also available, but this is not yet supported for Python scripting.
The result of the previous painting command can be visualized by using the Geometry plot item (with attributes “Type” = “Contour”, “Contour By” = “Node Extra”, and “Index” = “2”). The figure below is an example of painting the displacement magnitudes on a simple tunnel next to the main excavation.
Note that if the need for “painting” is temporary (i.e., for visualization), this can be done on a geometry plot item when plotting, which bypasses the command and the overhead required to store the field values at gridpoints. If the geometry <strong>set</strong>keyword is not given, then the current <strong>set</strong>is used.
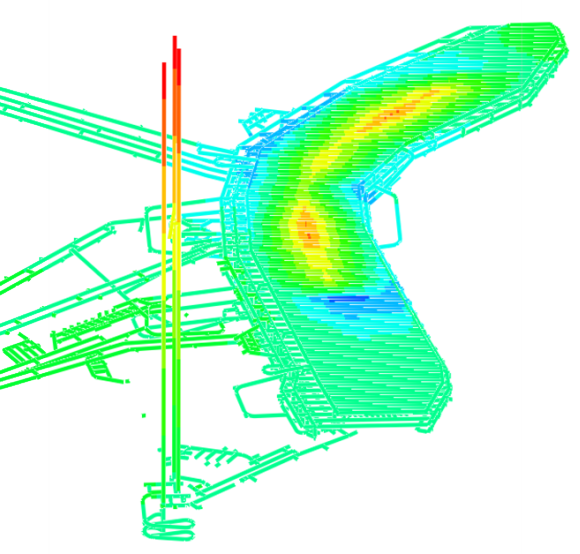
The following case shows tunnel strain painted onto an imported DXF of an underground mine. The tunnel strain is being estimated using a neural net formulation (based on tunnel shape, zone stress and zone global rock mass strength), stored as zone extra variable.
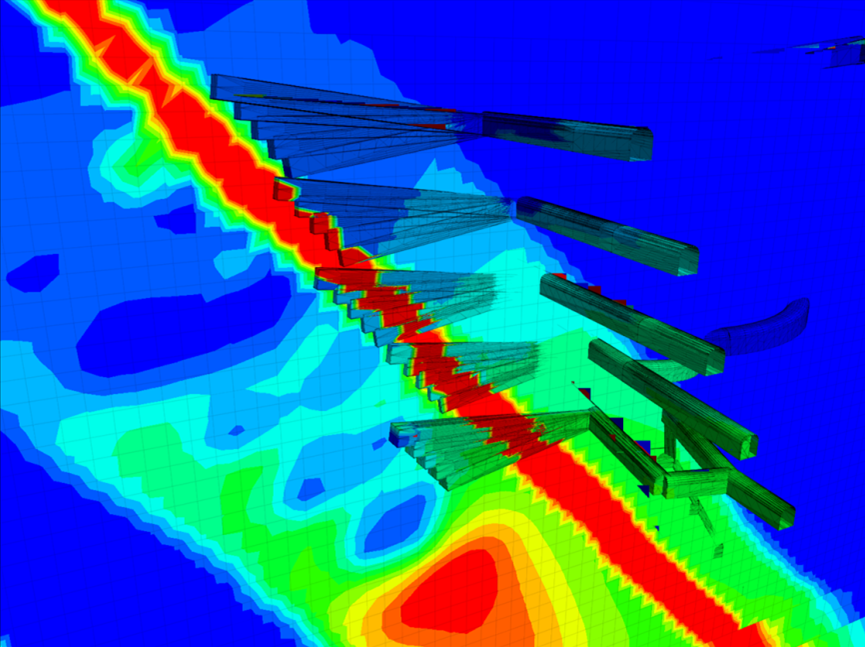
As a final note, it is also important to use a geometry that has a similar (or finer) resolution size to that of the model zoning to ensure good contouring. The following figure shows the same case as above, but with geometry meshing from a course DXF mesh, resulting in the data being smeared and not representative. In this case, use the geometry refine command to convert any triangular or quadrilateral polygons in the geometric set into smaller versions.
